Retrospective report
Week of 7 September 2026
Week-Ahead Model - MAX_AVAIL
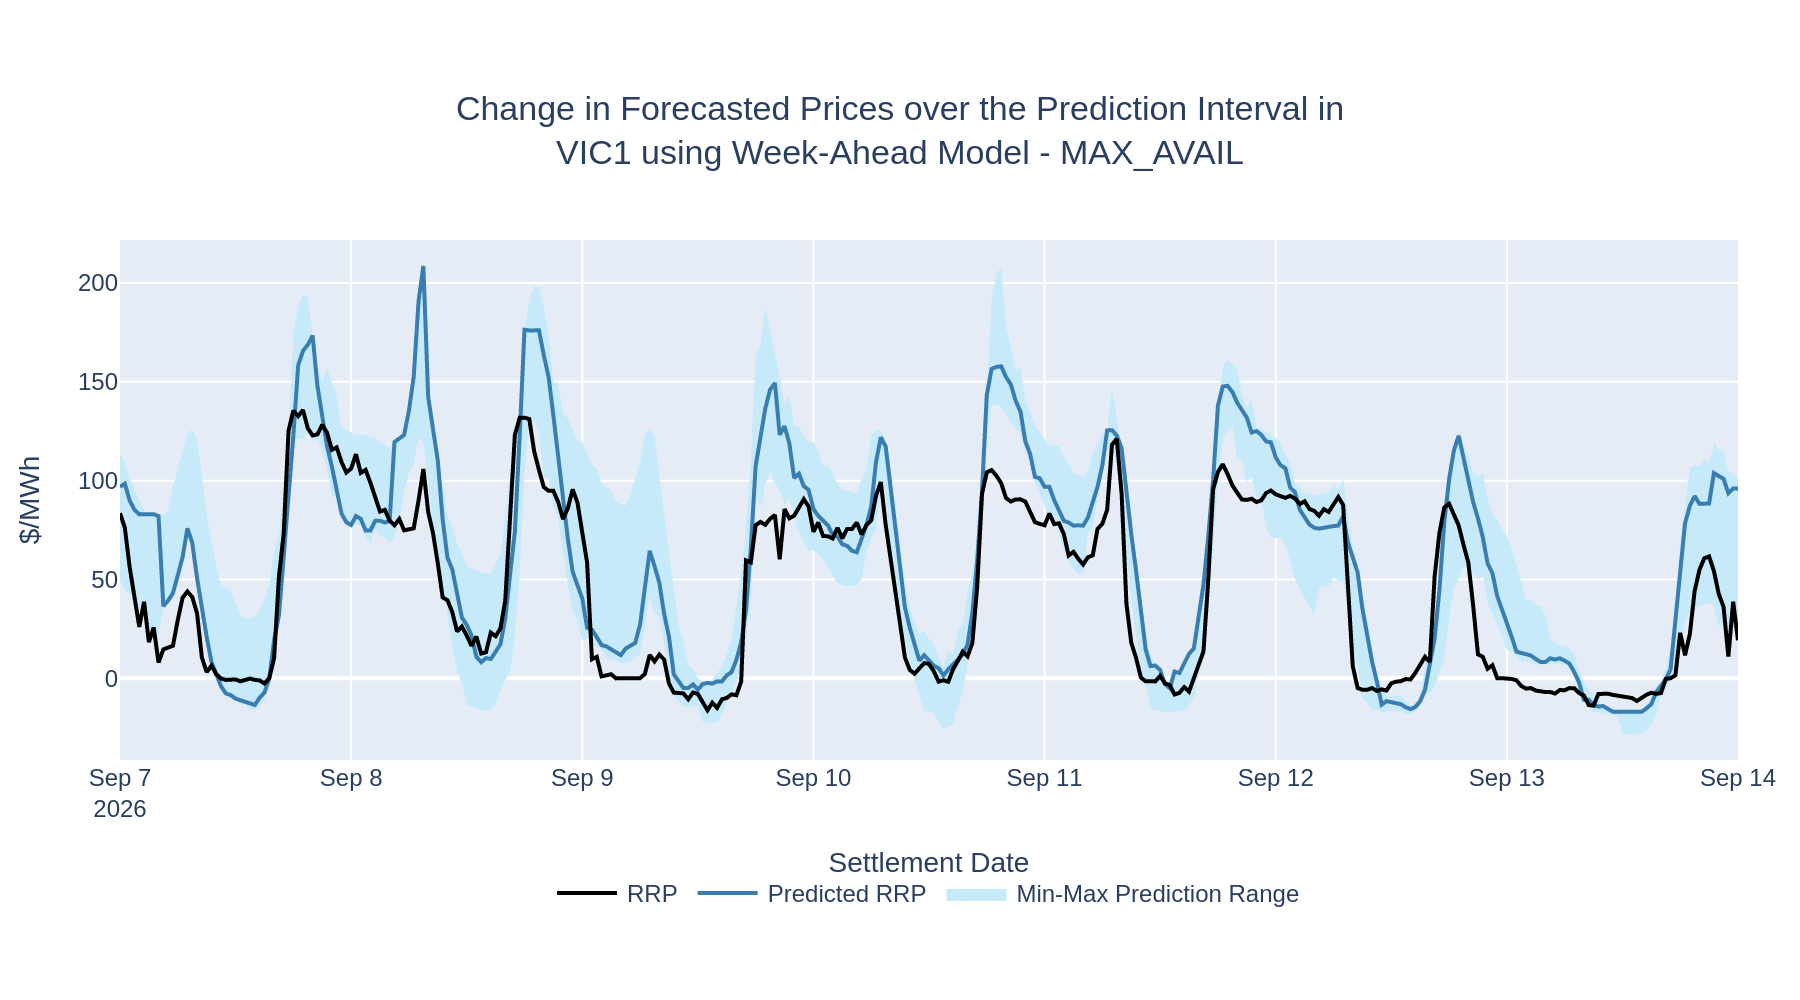
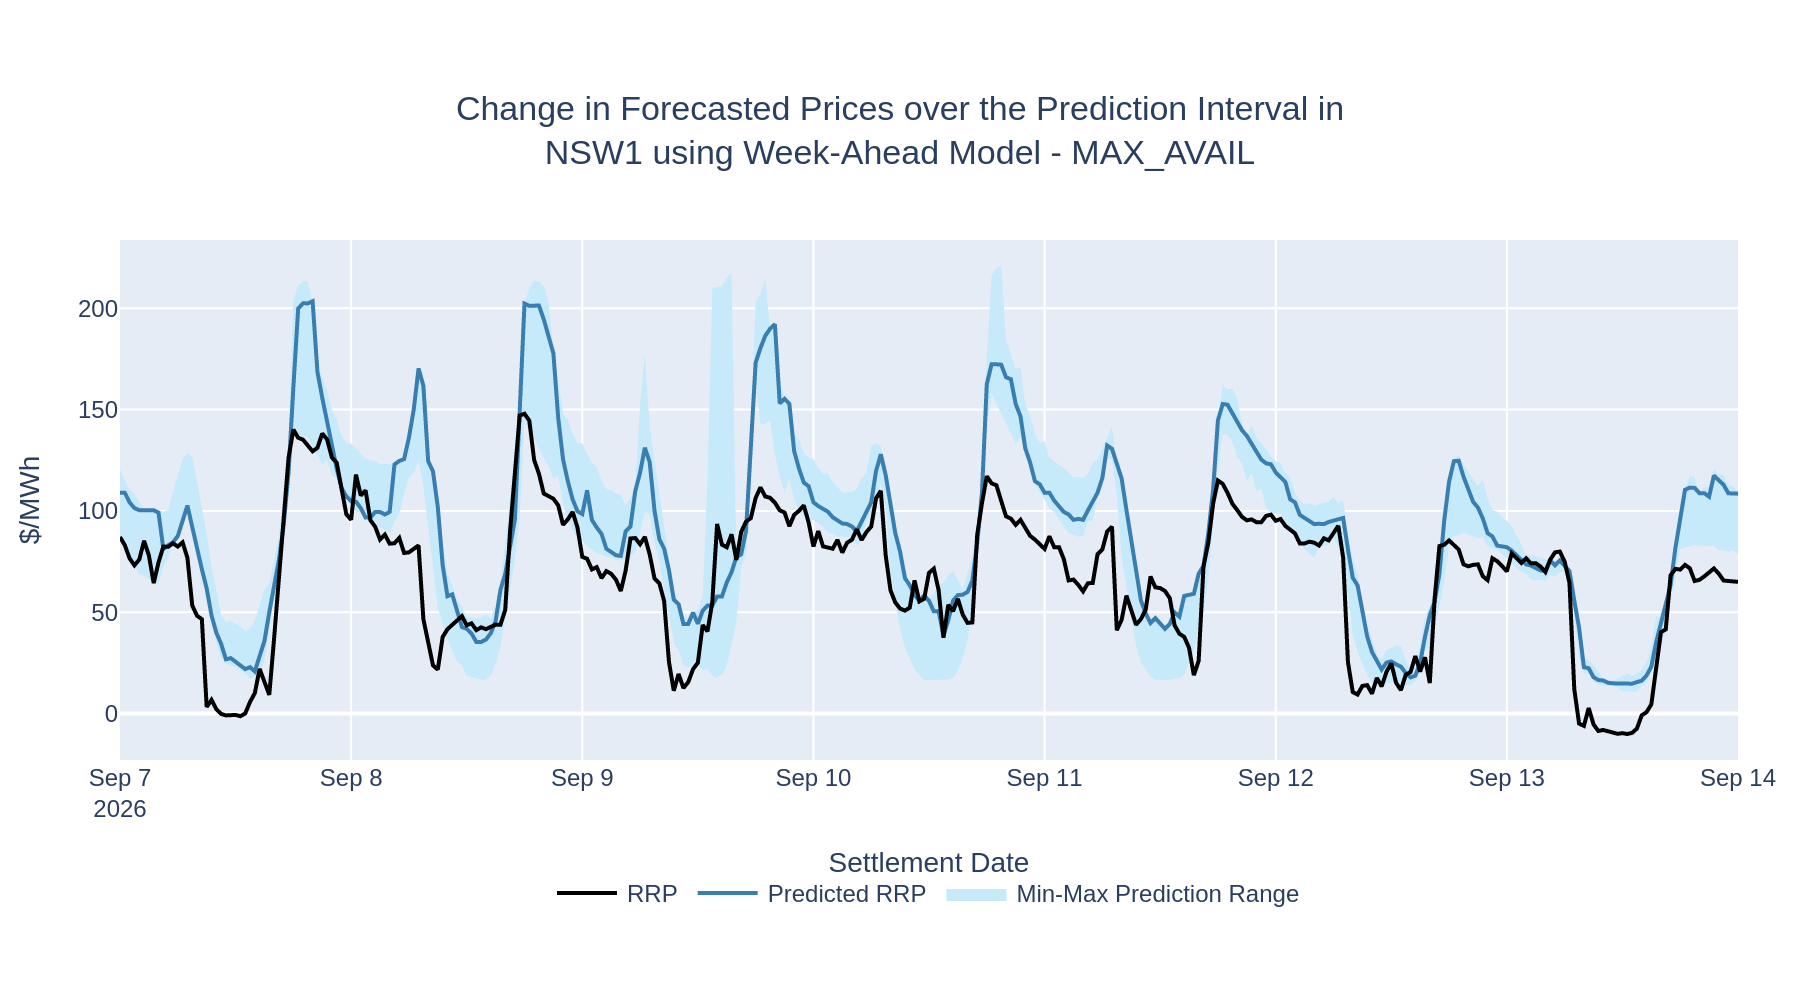
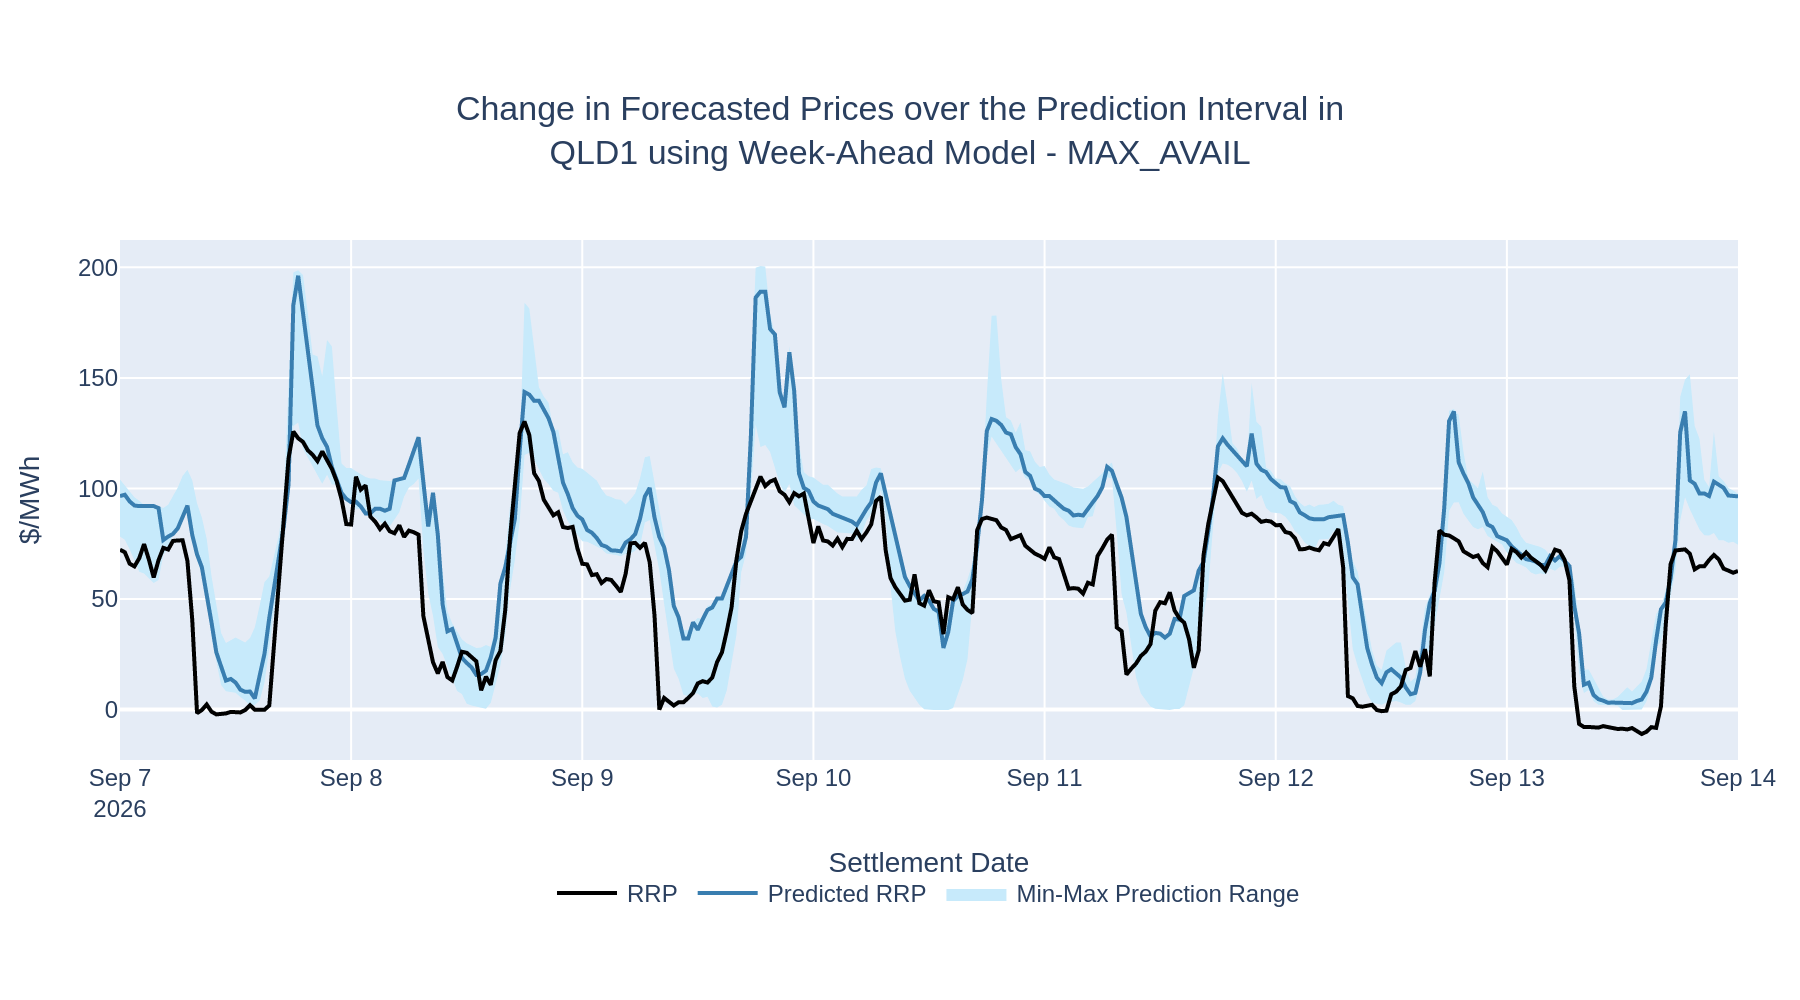
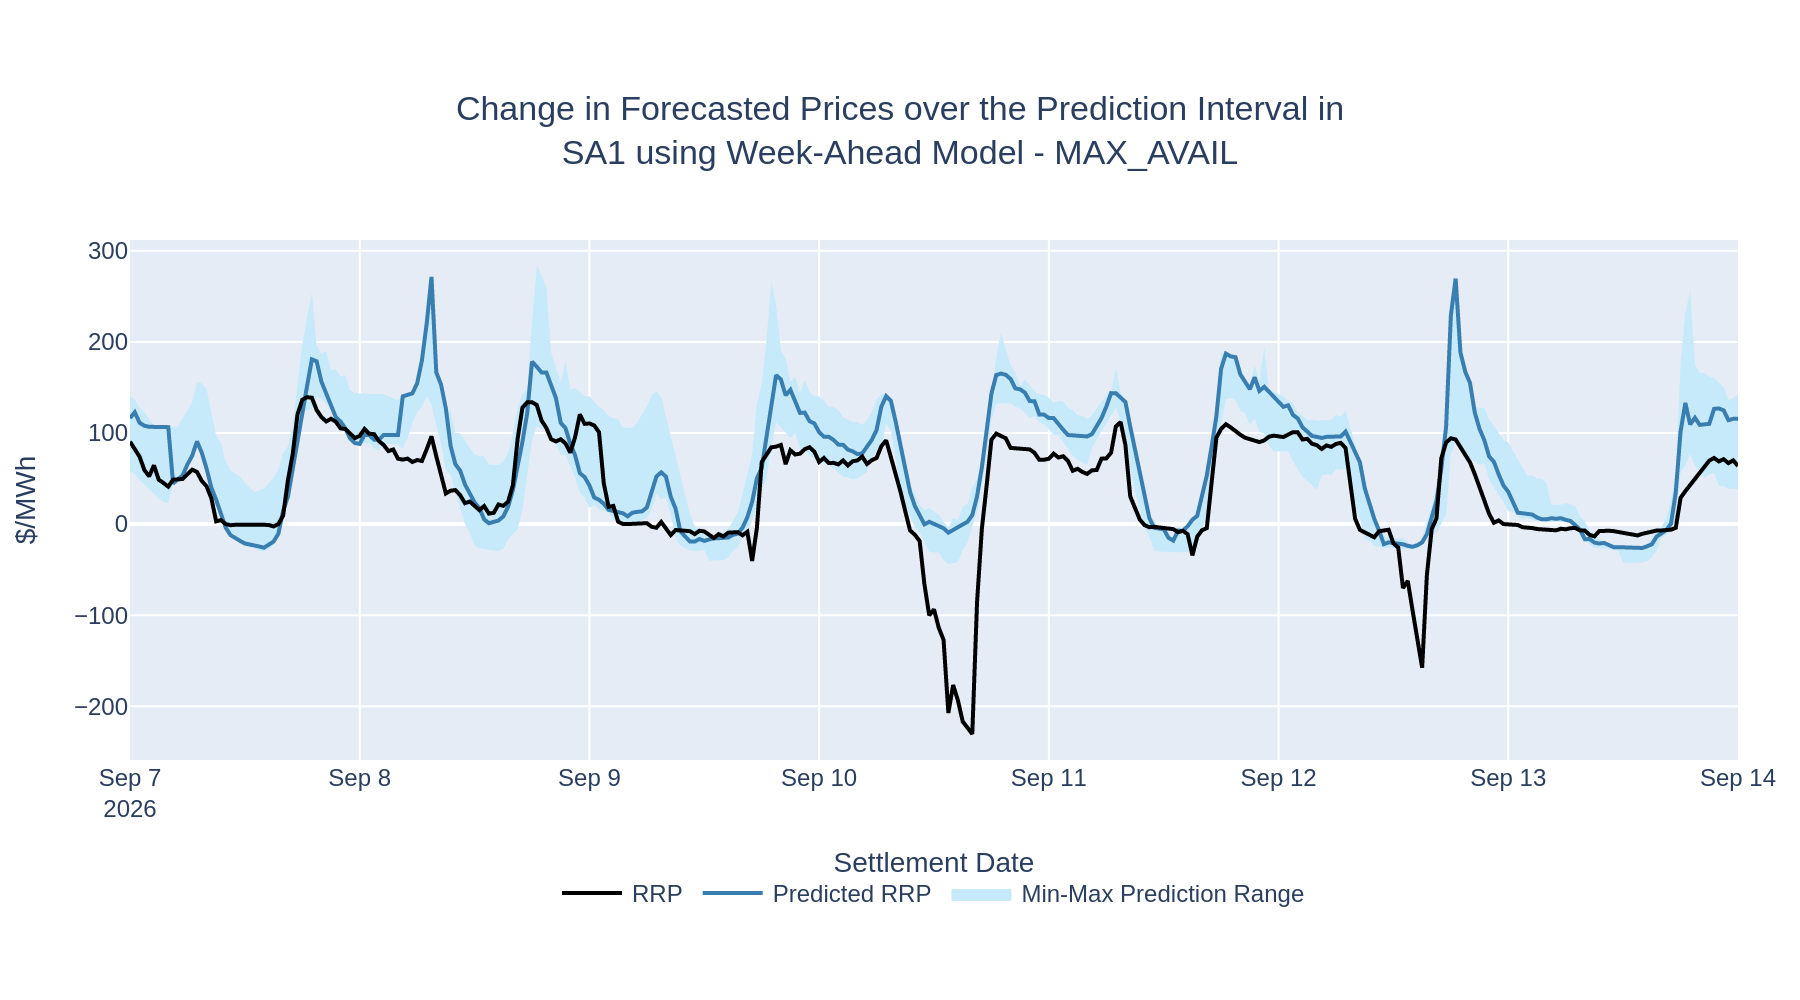
Per-region forecast accuracy for the Week-Ahead Model - MAX_AVAIL model group over the week of 7 September 2026.
Model revision 2
Generated 14 September 2026 at 7:59 am (Sydney time)
| Region | MAE1 | Bias2 | Average predicted price | Average actual price | Price spike windows3 |
|---|---|---|---|---|---|
| NSW1 | 24.81 | 18.19 | $85.44 | $67.24 | 0 |
| QLD1 | 21.90 | 15.29 | $71.82 | $56.54 | 0 |
| SA1 | 38.07 | 29.05 | $65.06 | $36.01 | 0 |
| VIC1 | 24.16 | 15.48 | $59.14 | $43.66 | 0 |
1Mean Absolute Error (MAE) is the average absolute difference between forecast and actual prices.
2Bias is the average difference between forecast and actual prices.
3To maintain an informative scale, we charted price spikes separately to other prices. We plotted the 6 hours before and after the RRP exceeded $500 as separate, region-specific charts. These price spikes are capped at $500 in the full region prediction charts.
NSW1
| Region | MAE | Bias | Average predicted price | Average actual price | Price spike windows |
|---|---|---|---|---|---|
| NSW1 | 24.81 | 18.19 | $85.44 | $67.24 | 0 |
QLD1
| Region | MAE | Bias | Average predicted price | Average actual price | Price spike windows |
|---|---|---|---|---|---|
| QLD1 | 21.90 | 15.29 | $71.82 | $56.54 | 0 |
SA1
| Region | MAE | Bias | Average predicted price | Average actual price | Price spike windows |
|---|---|---|---|---|---|
| SA1 | 38.07 | 29.05 | $65.06 | $36.01 | 0 |
VIC1
| Region | MAE | Bias | Average predicted price | Average actual price | Price spike windows |
|---|---|---|---|---|---|
| VIC1 | 24.16 | 15.48 | $59.14 | $43.66 | 0 |