Regulation 4 Second Causer Pays and Frequency Indicator Data
Our FCASpays platform provides three different pages to inspect the finance reports, performance metrics and enhanced physical data related to regulation FCAS.
- regulation FCAS performance metrics using the PJM market definition
- beautifully charted 4 second causer pays and FI enhanced data
- causer pays contribution factor reconciliation
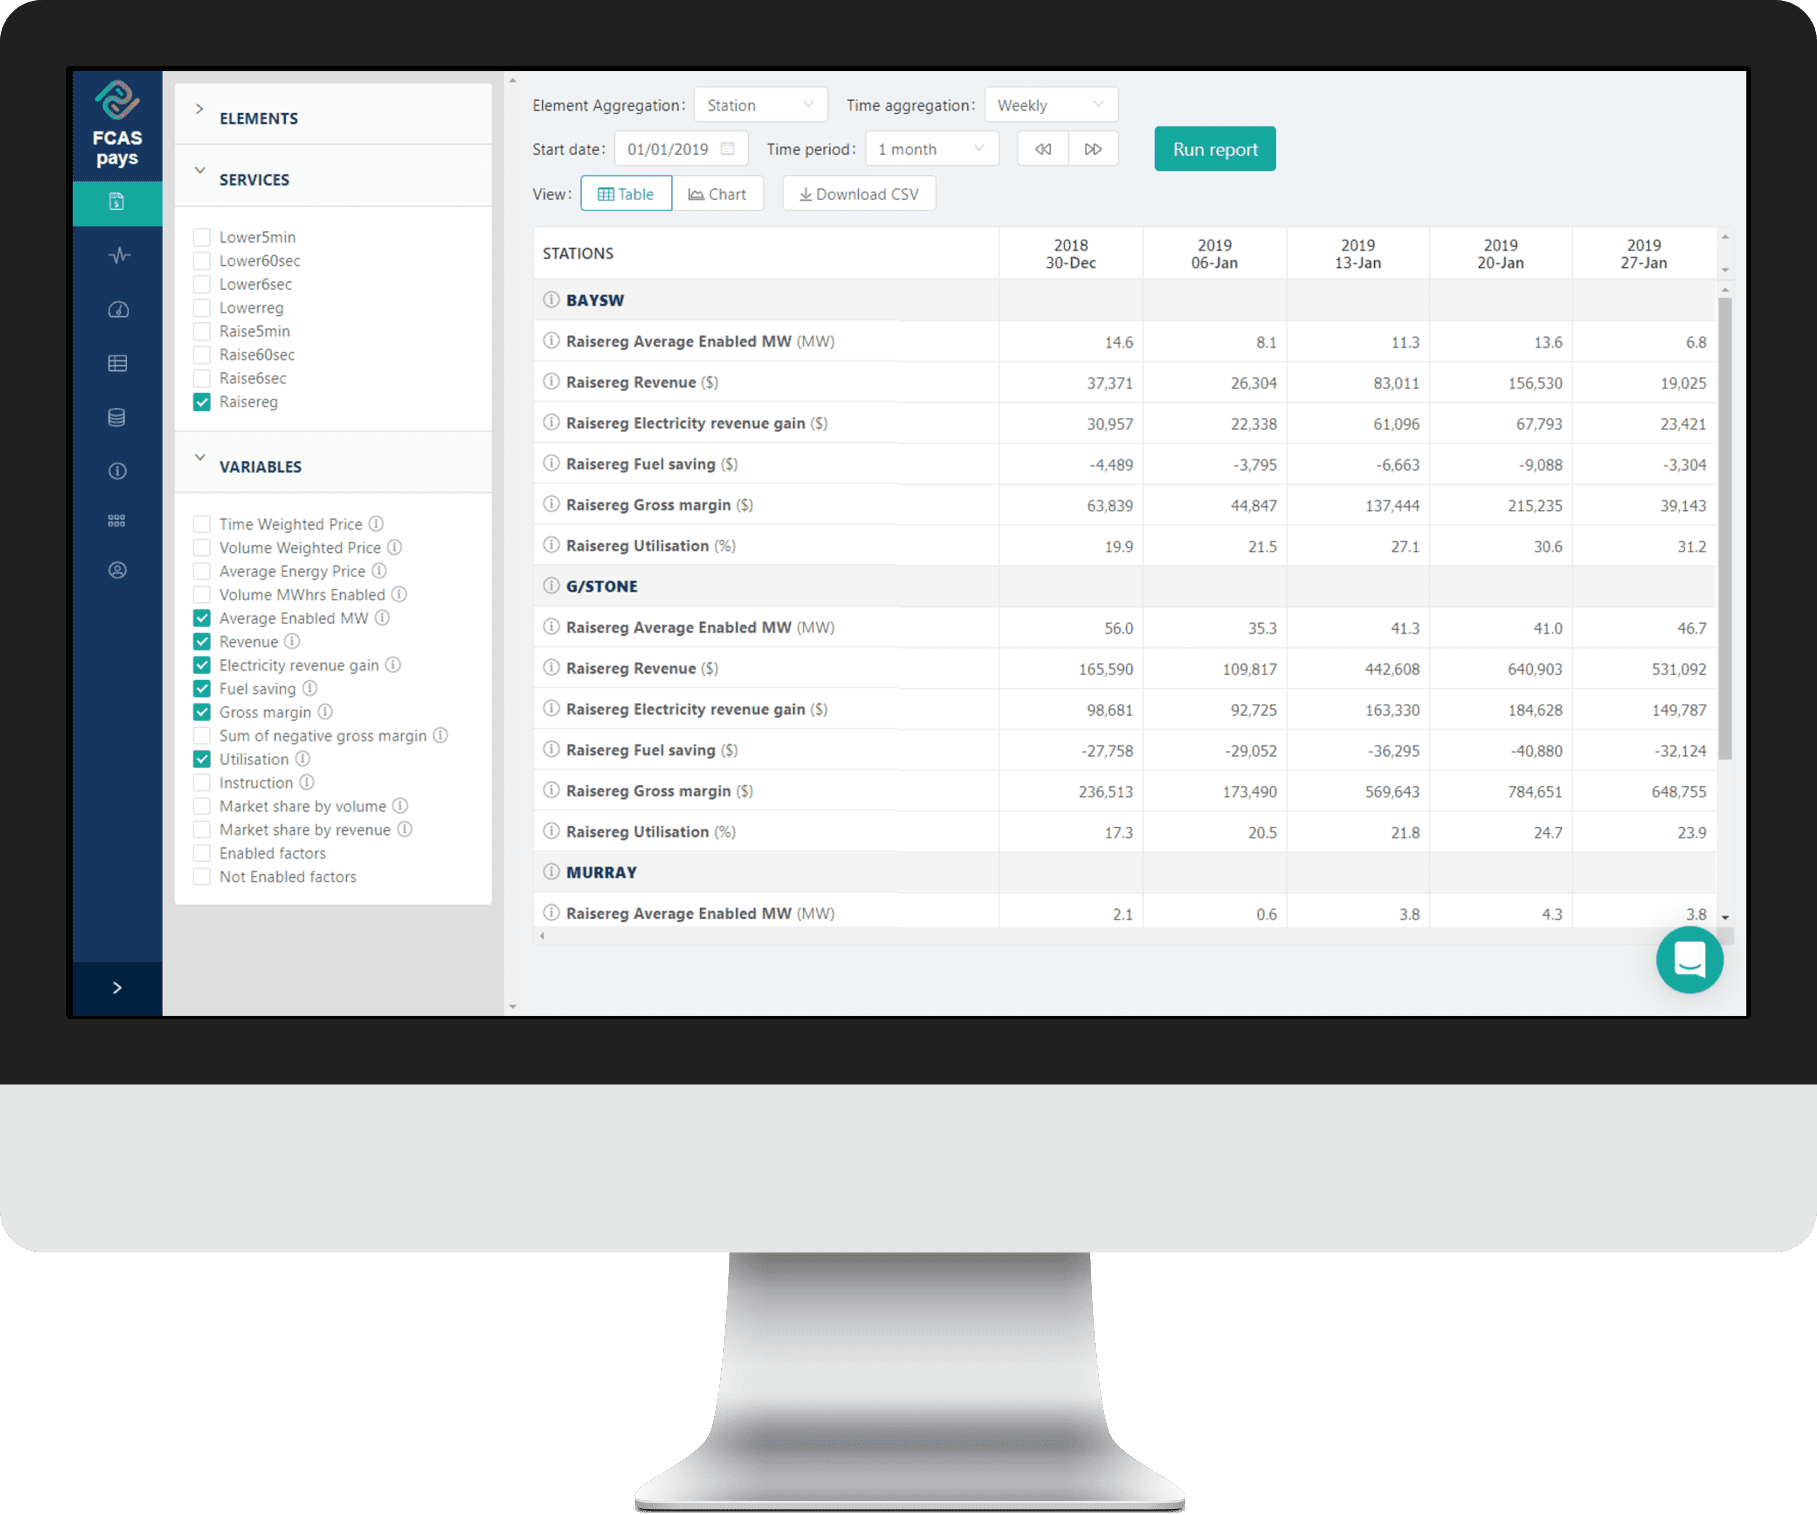
- breakdown of gross margin components in providing regulation FCAS
* Visualising unit instructions, response and frequency behaviour will allow you to monitor the efficacy in the provisioning of regulation FCAS and identify conditions when your regulation services can be better priced.
FCASpays uses enriched 4 second causer pays data, frequency indicator (FI) data and other NEM market data.

This service is consumed by plant exposed to regulation FCAS cost recovery, providers of regulation FCAS, regulators and regulatory teams interested in frequency and FCAS market design

Finance reports
- Breakdown of regulation FCAS gross margin
- Helps create a great business case for automating FCAS bids
- Understand the additional costs and benefits of regulation FCAS enablement
- See how providing regulation FCAS when energy prices are either high or negative can cost a lot of money
- See when you are enabled at a loss and where there are untapped opportunities
- Aggregate time from 5 minutes to yearly and units to station, portfolio and region level
- Includes enabled and non-enabled causer pays contribution factors

Performance metrics
- Modelled using the USA's PJM market performance metric definitions
- Our AGC signal approximation enables you to quickly identify poor performance of both your units and your competitors
- Identify free riders!
- Reduce liabilities
- Play your part to improve frequency by understanding contributions to frequency control
- Consume our data to support regulatory views

Enhanced physical data
- Beautiful charting of 4 second causer pays and frequency indicator data
- Clear visualisation of unit behaviour as a function of frequency and our AGC signal estimate
- Includes enriched data such as 4 second trajectory (linear extrapolation from previous dispatch target to current dispatch target)